In this blog, we will discuss how to become part of the elite of data visualization design. With the insight we will provide, you have an advantage in that it is recommendable that you use it if you want to become a top data visualization designer.
Data Visualization Basics
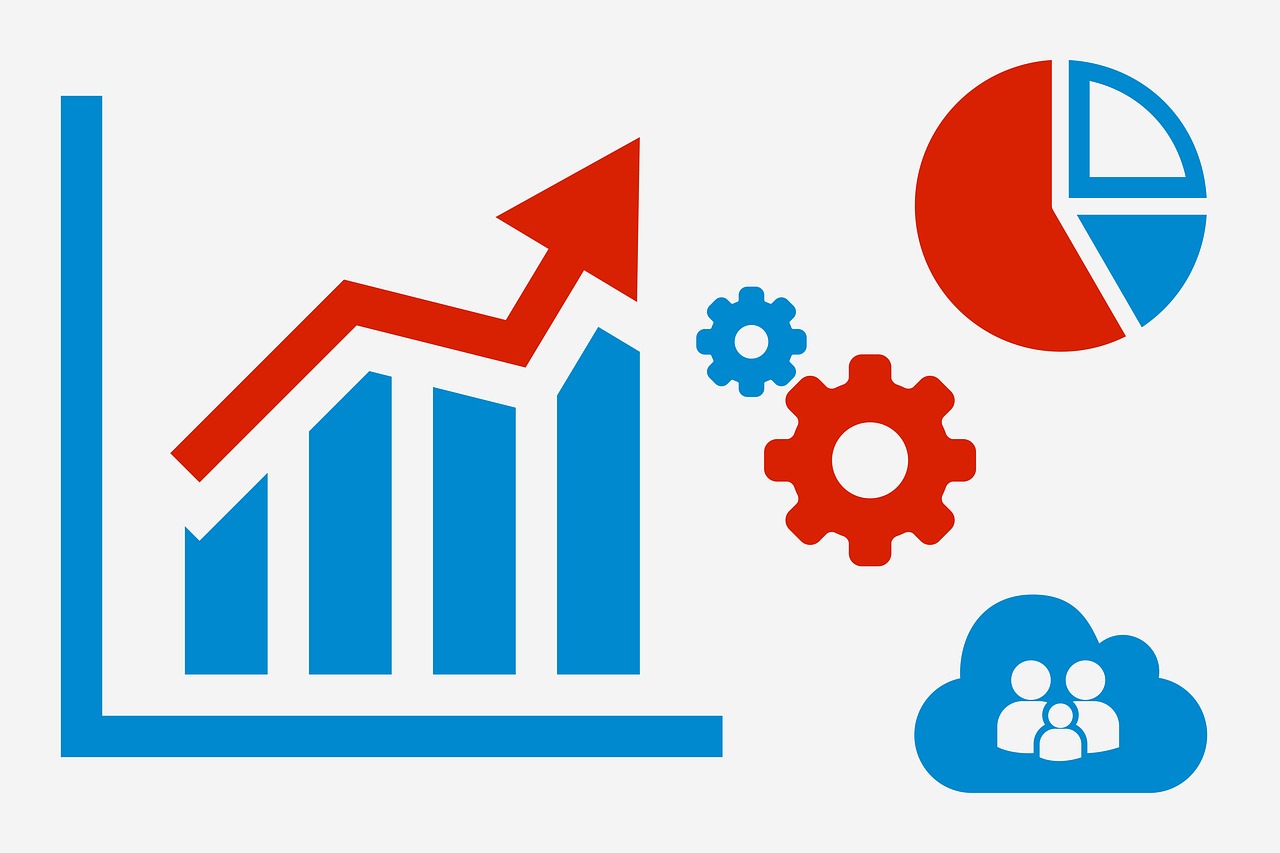
Creating charts, graphs, and maps from raw data are known as data visualization, and it has quickly become one of the most popular ways to publish information on the web. It helps in a wide variety of industries, from business intelligence to journalism for better knowledge and conveys the vision within data. Displaying data in visual form makes it more straightforward to grasp and analyze. It also helps in making decision-making faster and finding patterns, including new and hidden ones, to better understand complex concepts.
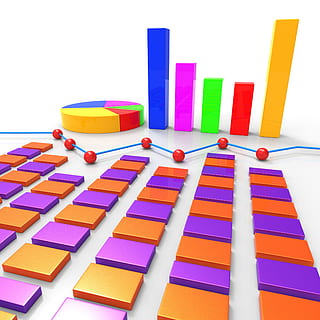
When information represents in graphic form, a person can realize more frequently and quickly even complicated things also. However, it does not require any technical skills and is easy to learn with the help of various tools. Data visualization can also be understood as information that has been abstracted in some schematic form, including attributes or variables for the units of information. In other words, it is a coherent way to visually communicate quantitative content. Depending on its attributes, the data may be represented in many different ways, such as a line graph, bar chart, pie chart, scatter plot, or map, among many others.
Graphic designers need to adhere to data visualization best practices and determine the best way to present a data set visually. Data visualizations should be useful, visually appealing, and never misleading. Particularly when working with very large data sets, developing a cohesive format is vital to creating visualizations that are both useful and visually appealing.
Why Use Data Visualization
It is a fact that 2.5 quintillion bytes of data are created every day. There is more data across the internet every second than what was stored on the entire internet just 20 years ago. As the world becomes more and more connected with an increasing number of electronic devices, the volume of data will continue to grow exponentially.
All of this data is hard for the human brain to comprehend. It is difficult for the human brain to comprehend numbers larger than five without drawing some kind of analogy or abstraction. Data visualization designers can play a vital role in creating those abstractions.
After all, big data is useless if it cannot be understood and consumed in a useful way. That is why data visualization plays an important role in everything from economics to science and technology, to healthcare and human services. By turning complex numbers and other pieces of information into graphs, content becomes easier to understand and use.
6 Best Practices for a Data Visualization Designer
In this section, we will discuss the things you need to do to become a top data visualization designer.
1. Apply Text Carefully and Intentionally
Here is a list of things you should do. At the top or upper left corner put all the vital points because the human eye is drawn to that place first. Try to add three or four views in a single dashboard as it is one of the best practices for it. Because if we add too many graphs, it will be difficult to understand. When applying multiple filters, group them, and add a border around them to make them more transparent and attractive.
2. Use the predictable pattern for layouts
Human eyes quickly caught indicators that help in understanding important information. You usually grab patterns, and if they are random or do not make sense, sometimes it is tough to understand what visualization wants to communicate. To know about human thinking, we have to represent data that make sense to viewers, whether it is sequential or numeric. If you are using no graphs, make sure the chart should be properly visible, and connections between data should be clear. Do not let your viewers get confused as it is not counted in its best practices and users can quickly they can go from to point to another.
3. Keep It Organized and Coherent
Coherence is especially important when compiling a big data set into a visualization. A coherent design will virtually fade into the background, enabling users to easily process data. The best visualizations help viewers reach conclusions about the data being presented without being “in-your-face” or otherwise drawing attention to themselves. They merely show the data in the best possible way.
4. Make Data Visualization Inclusive
Color is used extensively as a way to represent and differentiate information, and it is also a key factor in user decisions. People respond to different color combinations used in charts, assuming that they would have stronger preferences for palettes that had subtle color variations since they would be more aesthetically appealing. Nonetheless, they found that while appealing, subtle palettes made the charts more difficult to analyze and gain insights. That entirely defeats the purpose of creating a visualization to display data.
5. Use attractive colors for telling data stories
Colors play an important role in depicting graphs without using words. It helps to communicate a lot about your visuals. Try to keep it uncomplicated as it is one of the best practices for it. Using color for highlighting essential points helps to understand the dashboard more frequently and quickly. Proper Color clubbing matters a lot. The viewer can understand faster and promptly try to use natural colors. For instance, in a graph, use different shades of particular colors to show a profit for a specific month and the brightest for a month have the highest benefit.
6. Use attractive and straightforward Dashboards
As we know, most of the time dashboard contains several graphs so you should add three or four charts or graphs for better understanding. Try to use different colors for different figures for better knowledge of viewers because the dashboard is the main thing that will help the viewers to get the result and make decisions accordingly.
Conclusion
This advice will set you on the right way to becoming an elite data visualization designer. If you follow these guidelines, you will be a few steps ahead of the average designer.
